RightMark Audio Analyzer test report
| Testing device | [ASIO] U Solo Live |
| Sampling mode | 24-bit, 44 kHz |
| Interface | ASIO |
| Testing chain | line-out |
| RMAA Version | 6.4.5 PRO |
| 20 Hz - 20 kHz filter | ON |
| Normalize amplitude | ON |
| Level change | -1.3 dB / -1.2 dB |
| Mono mode | OFF |
| Calibration singal, Hz | 1000 |
| Polarity | correct/correct |
Summary
| Frequency response (from 40 Hz to 15 kHz), dB | +0.11, -0.14 |
Very good |
| Noise level, dB (A) | -105.1 |
Excellent |
| Dynamic range, dB (A) | 105.0 |
Excellent |
| THD, % | 0.00137 |
Excellent |
| THD + Noise, dB (A) | -92.2 |
Very good |
| IMD + Noise, % | 0.00440 |
Excellent |
| Stereo crosstalk, dB | -85.2 |
Excellent |
| IMD at 10 kHz, % | 0.00239 |
Excellent |
| General performance | Excellent |
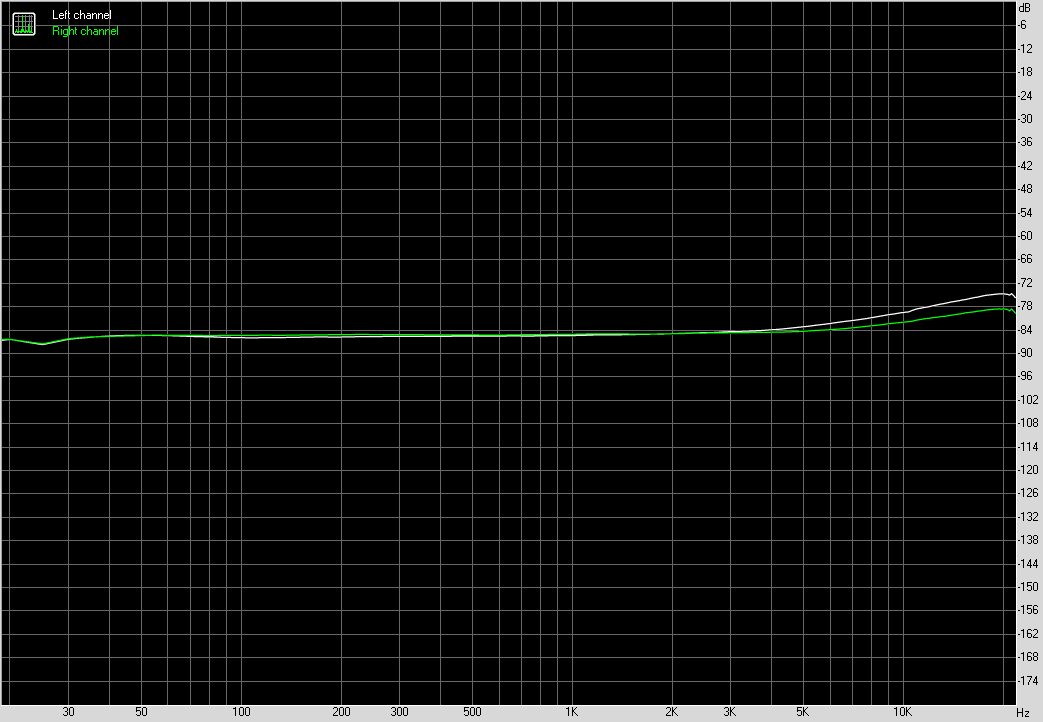
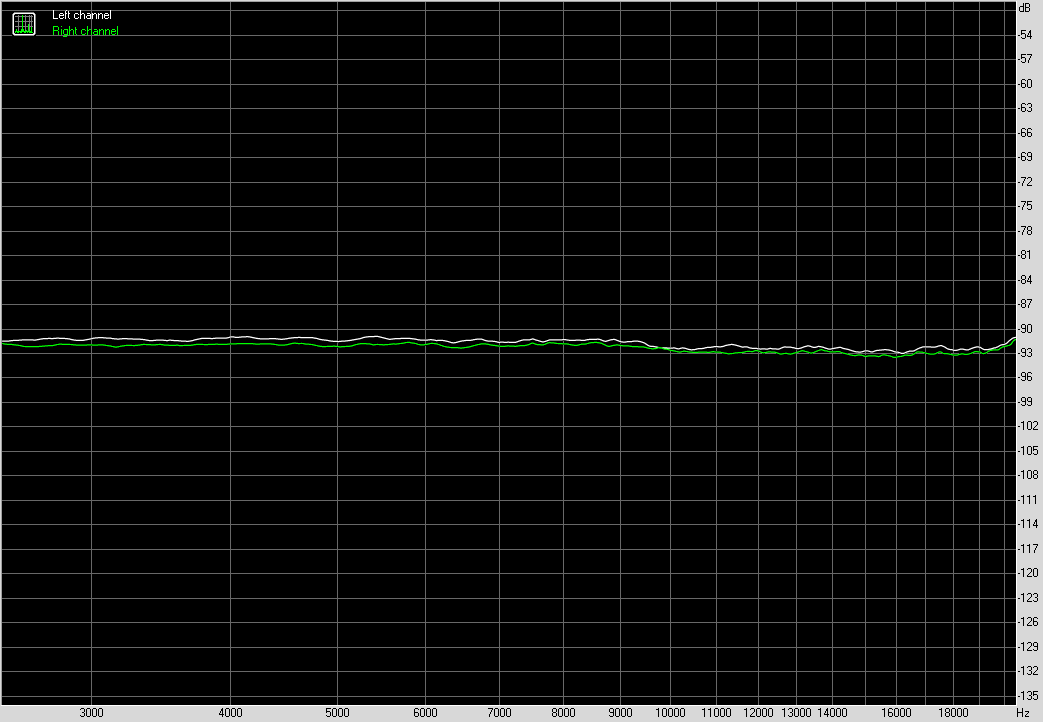
Frequency response
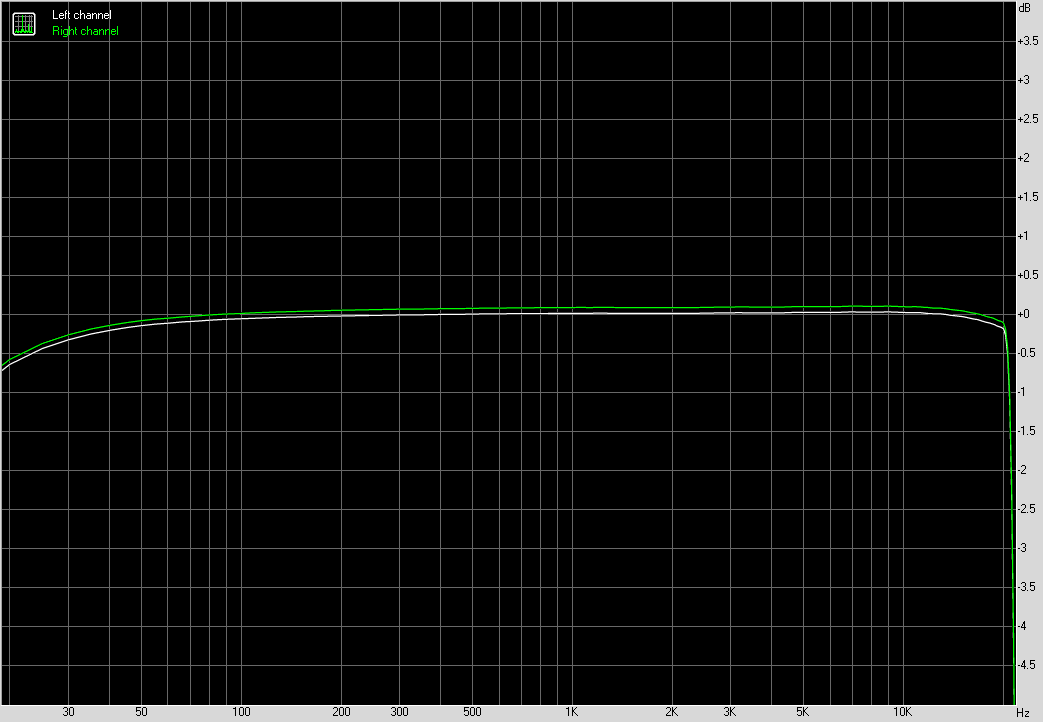
Left |
Right |
|
| From 20 Hz to 20 kHz, dB | -0.64, +0.03 |
-0.57, +0.11 |
| From 40 Hz to 15 kHz, dB | -0.20, +0.03 |
-0.14, +0.11 |
Noise level
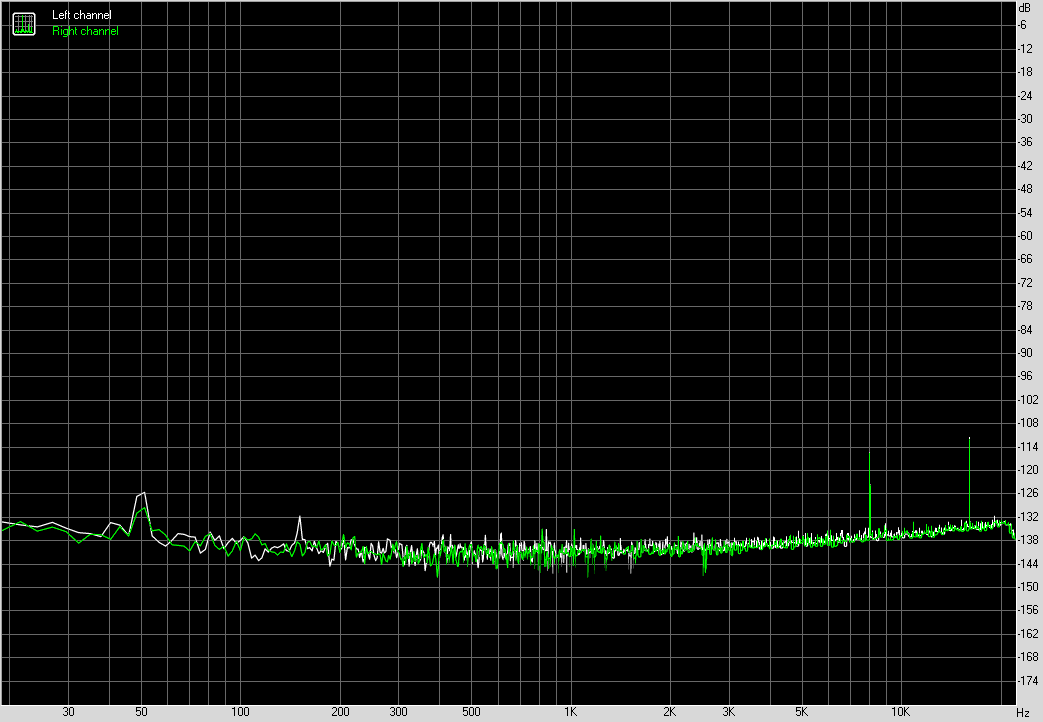
Left |
Right |
|
| RMS power, dB | -102.7 |
-103.0 |
| RMS power (A-weighted), dB | -104.9 |
-105.2 |
| Peak level, dB FS | -88.1 |
-88.6 |
| DC offset, % | +0.0 |
+0.0 |
Dynamic range
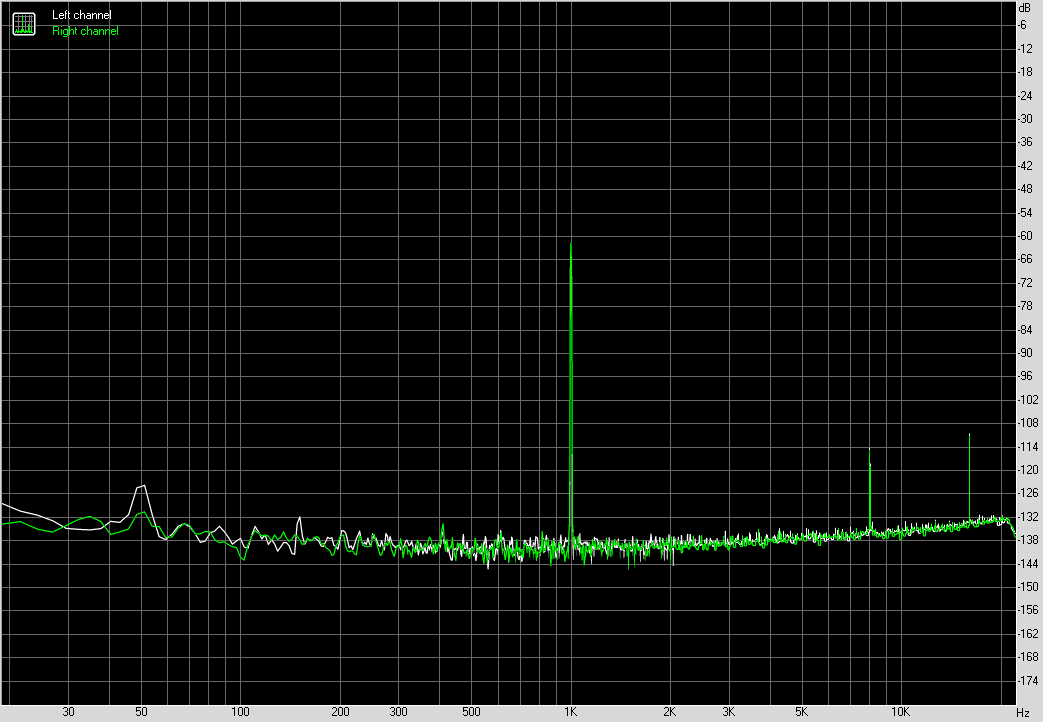
Left |
Right |
|
| Dynamic range, dB | +102.6 |
+103.0 |
| Dynamic range (A-weighted), dB | +104.9 |
+105.2 |
| DC offset, % | +0.00 |
-0.00 |
THD + Noise (at -3 dB FS)
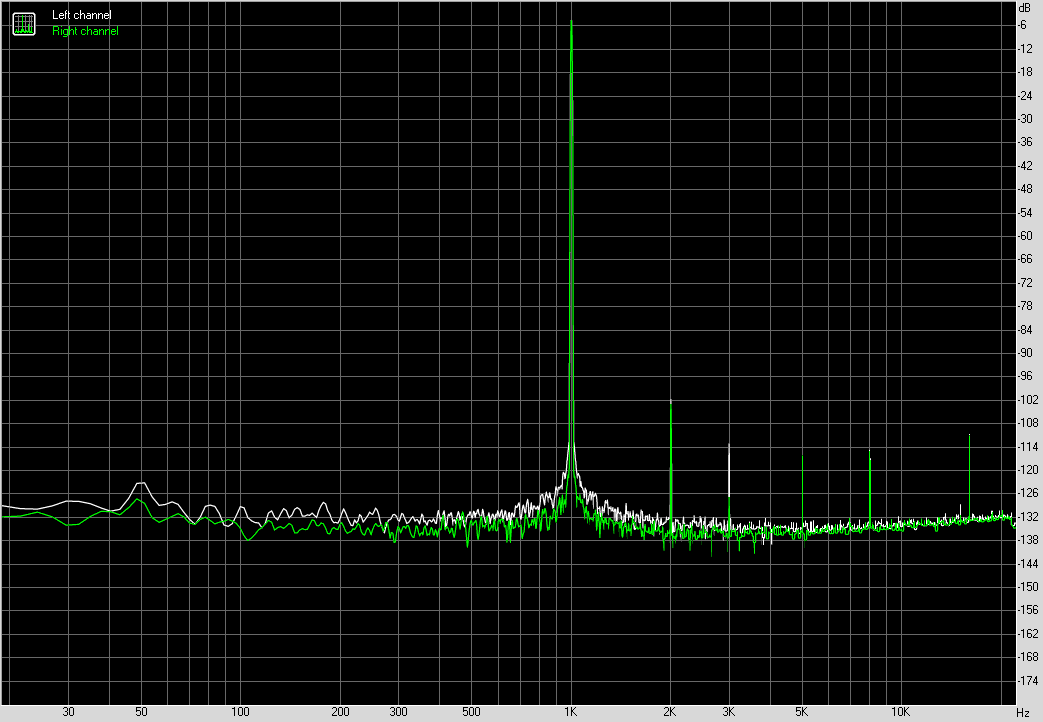
Left |
Right |
|
| THD, % | 0.00146 |
0.00128 |
| THD + Noise, % | 0.00266 |
0.00215 |
| THD + Noise (A-weighted), % | 0.00278 |
0.00215 |
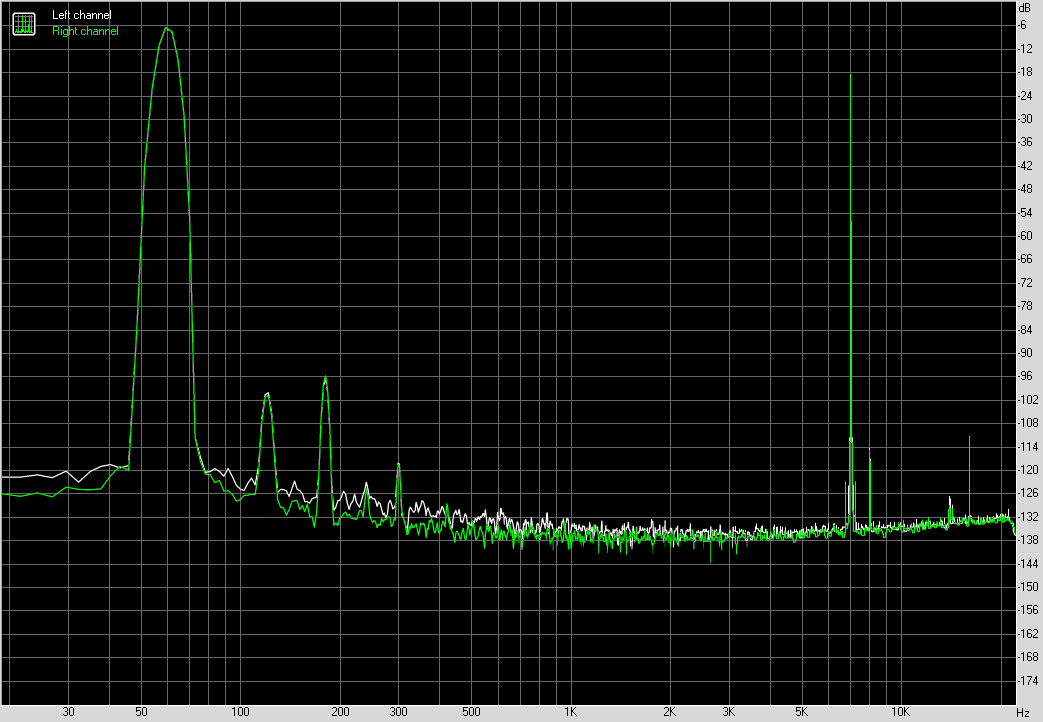
Intermodulation distortion
Left |
Right |
|
| IMD + Noise, % | 0.00444 |
0.00435 |
| IMD + Noise (A-weighted), % | 0.00219 |
0.00203 |
Stereo crosstalk
Left |
Right |
|
| Crosstalk at 100 Hz, dB | -85 |
-84 |
| Crosstalk at 1000 Hz, dB | -84 |
-84 |
| Crosstalk at 10000 Hz, dB | -78 |
-81 |
IMD (swept tones)
Left |
Right |
|
| IMD + Noise at 5000 Hz, | 0.00265 |
0.00247 |
| IMD + Noise at 10000 Hz, | 0.00241 |
0.00234 |
| IMD + Noise at 15000 Hz, | 0.00232 |
0.00215 |